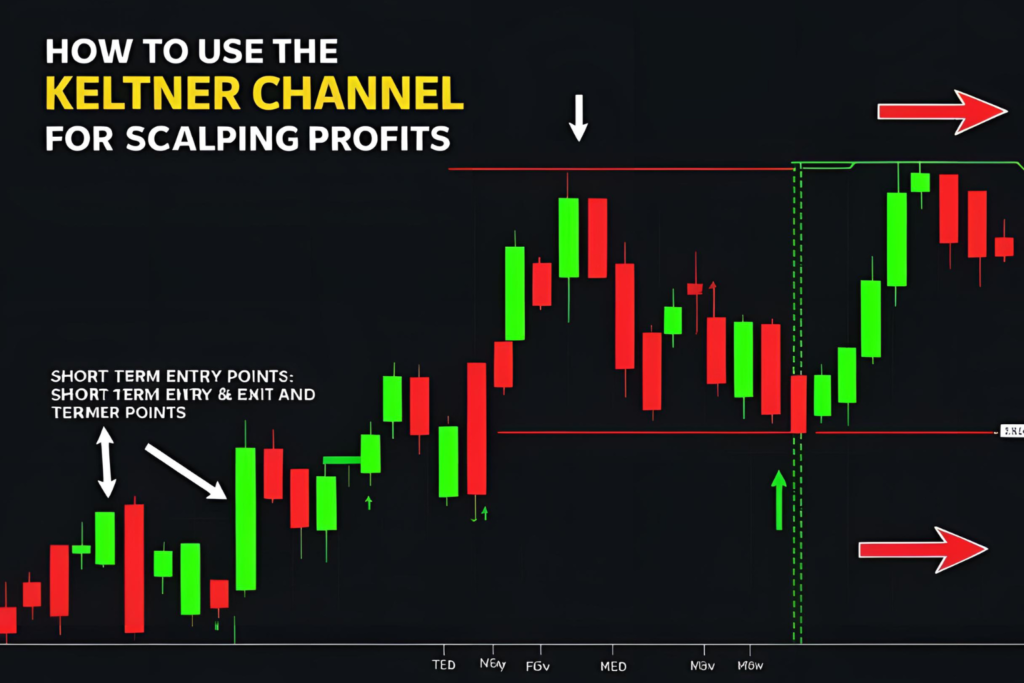
The Keltner Channel is excellent at identifying trend direction and volatility zones, but it becomes even more powerful when combined with momentum indicators like RSI and MACD.
This guide shows you how to use Keltner Channel with RSI or MACD to reduce false signals and confirm high-probability trade entries.
Why Combine Indicators?
- Keltner Channel shows price position and volatility
- RSI shows momentum and overbought/oversold conditions
- MACD shows trend strength and momentum shifts
By combining these tools, you filter out weak setups and time entries more accurately.
Strategy 1: Keltner Channel + RSI
Entry Conditions (Long Trade)
- Price pulls back to the EMA (middle band) of the Keltner Channel
- RSI remains above 50, confirming bullish momentum
- Enter when a bullish candle closes above the EMA line
Entry Conditions (Short Trade)
- Price touches or nears the EMA from below
- RSI is below 50, showing bearish strength
- Enter short on a bearish confirmation candle
Exit Strategy:
- Target upper or lower band
- Use RSI divergence or a close inside the opposite band as an exit signal
Best Use Case:
This combo is great for trend-pullback setups.
Strategy 2: Keltner Channel + MACD
Entry Conditions (Long Trade)
- MACD line crosses above the signal line
- Price closes above the upper Keltner band
- Enter on breakout confirmation candle
Entry Conditions (Short Trade)
- MACD line crosses below the signal line
- Price closes below the lower Keltner band
Exit Strategy:
- Use MACD crossover in the opposite direction
- Trail stop near EMA or opposite Keltner band
Best Use Case:
This works best in momentum-based breakouts or trend continuation trades.
Additional Tips
- Always use volume confirmation when combining these indicators
- Avoid overlapping timeframes; use consistent chart setups (e.g., 15-min, 1-hour, daily)
- Backtest combinations before applying them to live trades
- Use clean, minimal charts to stay focused
Example Setup: RSI + Keltner (Bullish)
- 1-hour chart of a stock in an uptrend
- Price pulls back to the Keltner midline
- RSI holds above 50 during the pullback
- Enter long on the next bullish candle
- Exit at upper band or use trailing stop
Final Thoughts
Using Keltner Channel with RSI or MACD helps filter out weak signals and gives more confidence when entering trades. RSI excels at confirming momentum during pullbacks, while MACD helps spot breakout or continuation signals.
Traders who combine trend structure (via Keltner Channel) with momentum (via RSI/MACD) often experience improved entry timing and trade consistency.
FAQs
1. Which is better to use with Keltner—RSI or MACD?
RSI is better for pullbacks; MACD is better for momentum breakouts.
2. What RSI setting should I use?
The default 14-period RSI works well with Keltner setups.
3. Can I use both RSI and MACD together with Keltner?
Yes, but only if it doesn’t overcomplicate your decision-making.
4. Should I change Keltner settings when combining with MACD?
You can tighten the multiplier to match MACD’s early signals if needed.
5. Does this combo work for crypto and forex?
Yes, especially in liquid, trending markets with strong volatility.


